
An Introduction to Basic Data Cleaning Techniques

An Introduction to Basic Data Cleaning Techniques
Data cleaning is one of the most overlooked steps in research, yet it is arguably one of the most important. Even the most carefully designed study can produce messy data: missing values, inaccurate entries, duplicate responses, or outliers that distort the story you’re trying to tell. If these issues aren’t addressed, the insights drawn from the analysis can become misleading or completely incorrect.
For researchers, students, analysts, and businesses alike, understanding basic data cleaning techniques is essential. Clean data ensures that patterns are real, statistics are reliable, and decisions are based on truth rather than noise. This introduction provides a clear, accessible guide to the foundational techniques that strengthen data quality.
Why Data Cleaning Matters
Raw data is rarely perfect. Respondents skip questions, misinterpret items, or enter impossible values. Digital systems can duplicate submissions or save data in inconsistent formats. If these issues are ignored, the analysis may exaggerate or hide trends.
Clean data allows researchers to trust what they see. It improves accuracy, enhances statistical validity, and ensures that interpretations reflect real behavior, not errors, glitches, or guesswork. In many ways, data cleaning is the “quality control” phase of research — the step that protects the integrity of every insight that follows.
Dealing With Missing Data
Missing data is one of the most common issues researchers face. Some respondents skip questions intentionally, while others drop off before completing the survey. Sometimes technical issues also result in lost values.
Understanding why data is missing is important. Some gaps may be random; others may signal a problem with question design or survey flow.
Basic approaches include:
-
Removing records with too much missing information, especially when respondents abandon the survey early.
-
Imputing missing values using averages, medians, or predictive methods when appropriate.
-
Treating “missing” as a meaningful category, especially for qualitative or demographic variables.
The goal is to preserve as much useful information as possible without introducing bias.
Identifying and Handling Outliers
Outliers are values that fall far outside the normal range. Sometimes they represent genuine extreme behavior; other times they are errors — mistyped values, measurement mistakes, or respondent misunderstandings.
A respondent reporting a monthly grocery spend of “1,000,000” may simply have added extra zeros. A study on adult media consumption might include a participant who mistakenly selects “17 years old” due to a scrolling error.
Outliers should be reviewed carefully:
-
Some require correction.
-
Others should be excluded from analysis.
-
Occasionally, they are real and should remain.
The key is making thoughtful decisions based on context rather than deleting anything that looks “different.”
Removing Duplicate Entries
Duplicates happen more often than researchers expect. Respondents may take the survey more than once, especially if incentives are offered. Technical glitches can also create repeated submissions.
Duplicate responses can distort results, particularly in small samples or studies involving behavioral tracking. Removing duplicates — using respondent IDs, timestamps, or matching answer patterns — helps restore accuracy.
Correcting Inconsistent or Invalid Values
Data often arrives in inconsistent formats. Dates may be written differently, numeric entries may appear as text, and categorical responses may contain spelling variations (“Nairobi,” “Nrb,” “Nai”). These inconsistencies prevent accurate grouping, filtering, or statistical modeling.
Cleaning involves:
-
Standardizing formats (e.g., all dates in YYYY-MM-DD form).
-
Normalizing text responses (e.g., consistent capitalization and spelling).
-
Correcting obvious input mistakes.
This ensures that categories align and variables behave correctly during analysis.
Checking for Logical Consistency
Some responses conflict with each other in ways that clearly indicate error. For example:
-
A respondent indicates they are “not a customer,” then answers detailed questions about product usage.
-
An individual selects “65+ years old” but reports being a “first-year university student.”
-
Someone says they “rarely use social media” but later reports spending “4+ hours daily” online.
Logical checks help identify such contradictions. These cases may be corrected, flagged for caution, or removed depending on severity.
Re-coding and Categorizing Variables
Raw datasets often contain long lists of unique responses that must be grouped into meaningful categories. For example:
-
Dozens of job titles may need to be grouped into occupational categories.
-
Open-ended responses about income or education levels may need consistent coding.
-
Age may need to be converted into age groups.
Re-coding transforms messy, granular data into organized variables that can be analyzed more effectively.
Ensuring Data Is Ready for Analysis
Once cleaning steps are complete, datasets must be reviewed again to ensure readiness. This includes checking distributions, verifying sample sizes across groups, reviewing variable types, and ensuring that the dataset aligns with the research design.
Clean data supports:
-
Accurate statistical testing
-
Reliable segmentation
-
Strong descriptive analysis
-
Meaningful visualizations
It is the bridge between raw information and usable insight.
Conclusion
Data cleaning may not be the most glamorous part of research, but it is one of the most important. Clean data strengthens confidence, protects against flawed conclusions, and ensures that the insights drawn truly reflect the population being studied. By mastering basic data cleaning techniques, researchers set the foundation for high-quality analysis and sound decision-making.
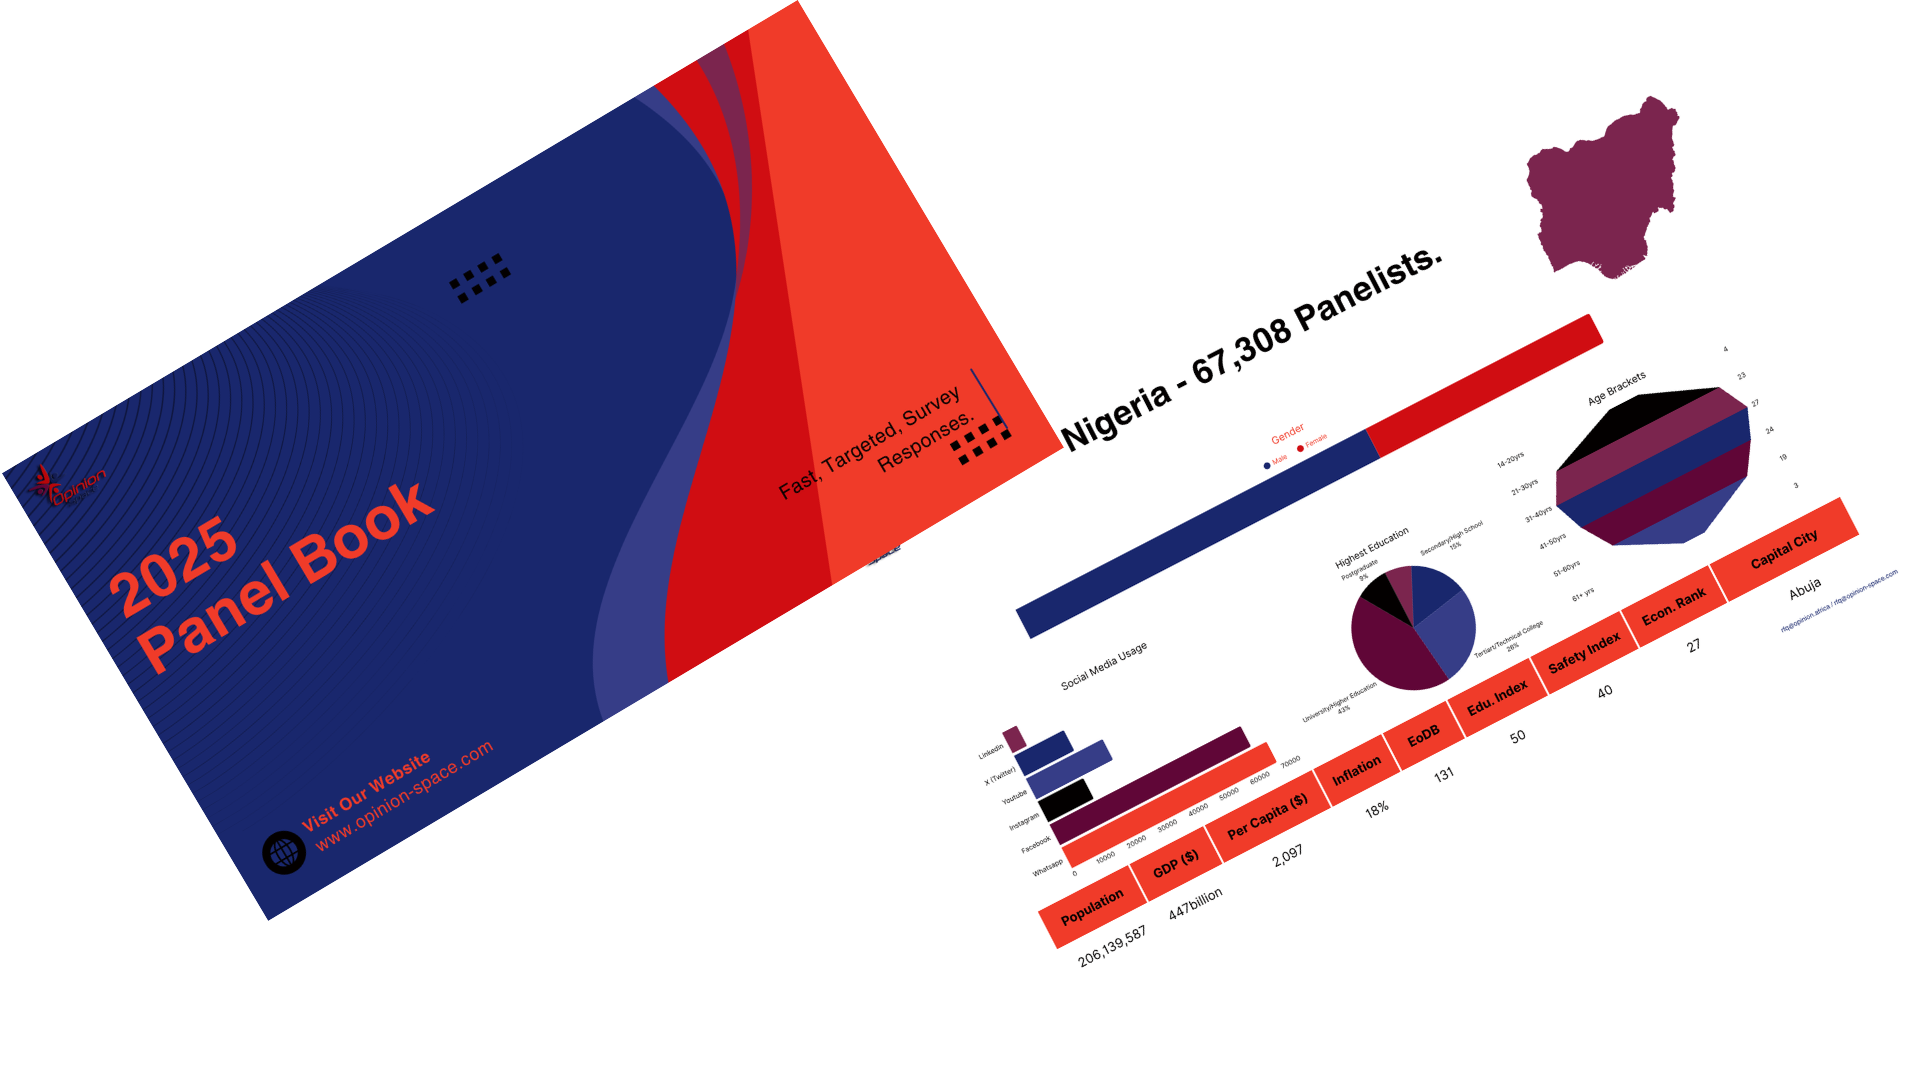
Download Our Latest Panel Book