
How to Present Research Findings Effectively

How to Present Research Findings Effectively
Presenting research findings is just as important as conducting the research itself. Even the most carefully designed study can fall flat if the results are communicated poorly. Effective presentation transforms raw data into compelling insights — insights that inform decisions, spark discussion, and demonstrate your understanding of the topic.
Whether you’re preparing a school report, a university thesis, or a professional presentation, your goal is the same: make your findings clear, meaningful, and easy for your audience to understand. This guide walks you through the essentials of presenting research in a way that captures attention and communicates value.
Know Your Audience Before You Begin
The first step in presenting research is understanding who will be receiving it. Teachers, classmates, community members, or business stakeholders all have different expectations and levels of familiarity with research concepts.
Ask yourself:
- What does my audience already know?
- What do they need to understand most?
- What level of detail is appropriate?
Tailoring your language, visuals, and explanations makes your presentation far more engaging and effective.
Start With a Clear Structure
Strong presentations follow a logical flow. This helps your audience stay oriented as they move through your findings.
A useful structure looks like this:
- Introduction — What you studied and why it matters
- Methodology — A brief overview of how you collected data
- Key Findings — The main results from your analysis
- Interpretation — What these results mean
- Conclusion — The overall message or takeaway
- Recommendations — Optional, depending on the assignment
Clear structure keeps your presentation organized and confidence-inspiring.
Highlight the Most Important Findings
Not all data deserves equal attention. Effective presenters focus on the findings that matter most — the results that answer the research question directly, contradict assumptions, or provide deep insight.
Instead of overwhelming your audience with numbers, choose:
- The strongest patterns
- The biggest contrasts
- The most relevant statistics
- The most insightful quotes
This demonstrates that you not only collected data but also understood its significance.
Use Visuals to Make Data Understandable
Visuals are powerful tools for making complex information clear and memorable. Charts, graphs, tables, and icons help your audience grasp patterns quickly.
Effective visuals include:
- Bar charts for comparisons
- Pie charts for proportions
- Line graphs for trends
- Tables when exact numbers matter
But remember: visuals should simplify, not confuse. Label everything clearly, avoid overcrowded charts, and choose colors that make information easy to see.
Explain What the Results Mean (Not Just What They Are)
One of the most common mistakes students make is presenting numbers without interpretation. Simply stating, “60% of respondents prefer option A,” is only half the job. Your audience needs to know:
- Why is this important?
- What does it reveal?
- How does it relate to the research question?
Interpretation links your findings to your objectives and demonstrates deeper understanding.
Incorporate Quotes to Bring Findings to Life
If your project includes open-ended responses, interviews, or qualitative data, use direct quotes to give your findings emotional depth. Quotes provide context and help illustrate how real people think or feel.
Choose short, powerful statements that reflect common themes or particularly meaningful insights.
Be Honest About Limitations
All research has limitations — small sample sizes, limited time, biased responses, or lack of access to certain groups. Acknowledging limitations doesn’t weaken your presentation; it strengthens your credibility.
It shows that you understand the boundaries of your work and can evaluate it critically.
Keep Your Language Clear and Accessible
Effective research presentations avoid jargon, overly academic wording, or complicated explanations. Your job is to communicate clearly, not impress with difficult vocabulary.
Use:
- Simple sentences
- Everyday language
- Clear definitions for key terms
A presentation that is easy to understand is always more impactful.
Practice Delivery and Engage Your Audience
Presenting findings isn’t just about content — it’s also about delivery. Practice your timing, tone, and flow. Avoid reading directly from slides; instead, speak conversationally and make eye contact.
Engage your audience by:
- Asking short questions
- Using relatable examples
- Pausing for emphasis
- Showing enthusiasm for your topic
Confident presentation makes your findings more persuasive and memorable.
Conclusion
Presenting research findings effectively is a skill that blends clarity, structure, and storytelling. When you highlight key results, use strong visuals, offer thoughtful interpretation, and speak confidently, your presentation becomes more than a summary — it becomes a powerful communication tool.
Whether for school, university, or professional settings, mastering this skill ensures your hard work is understood, appreciated, and impactful.
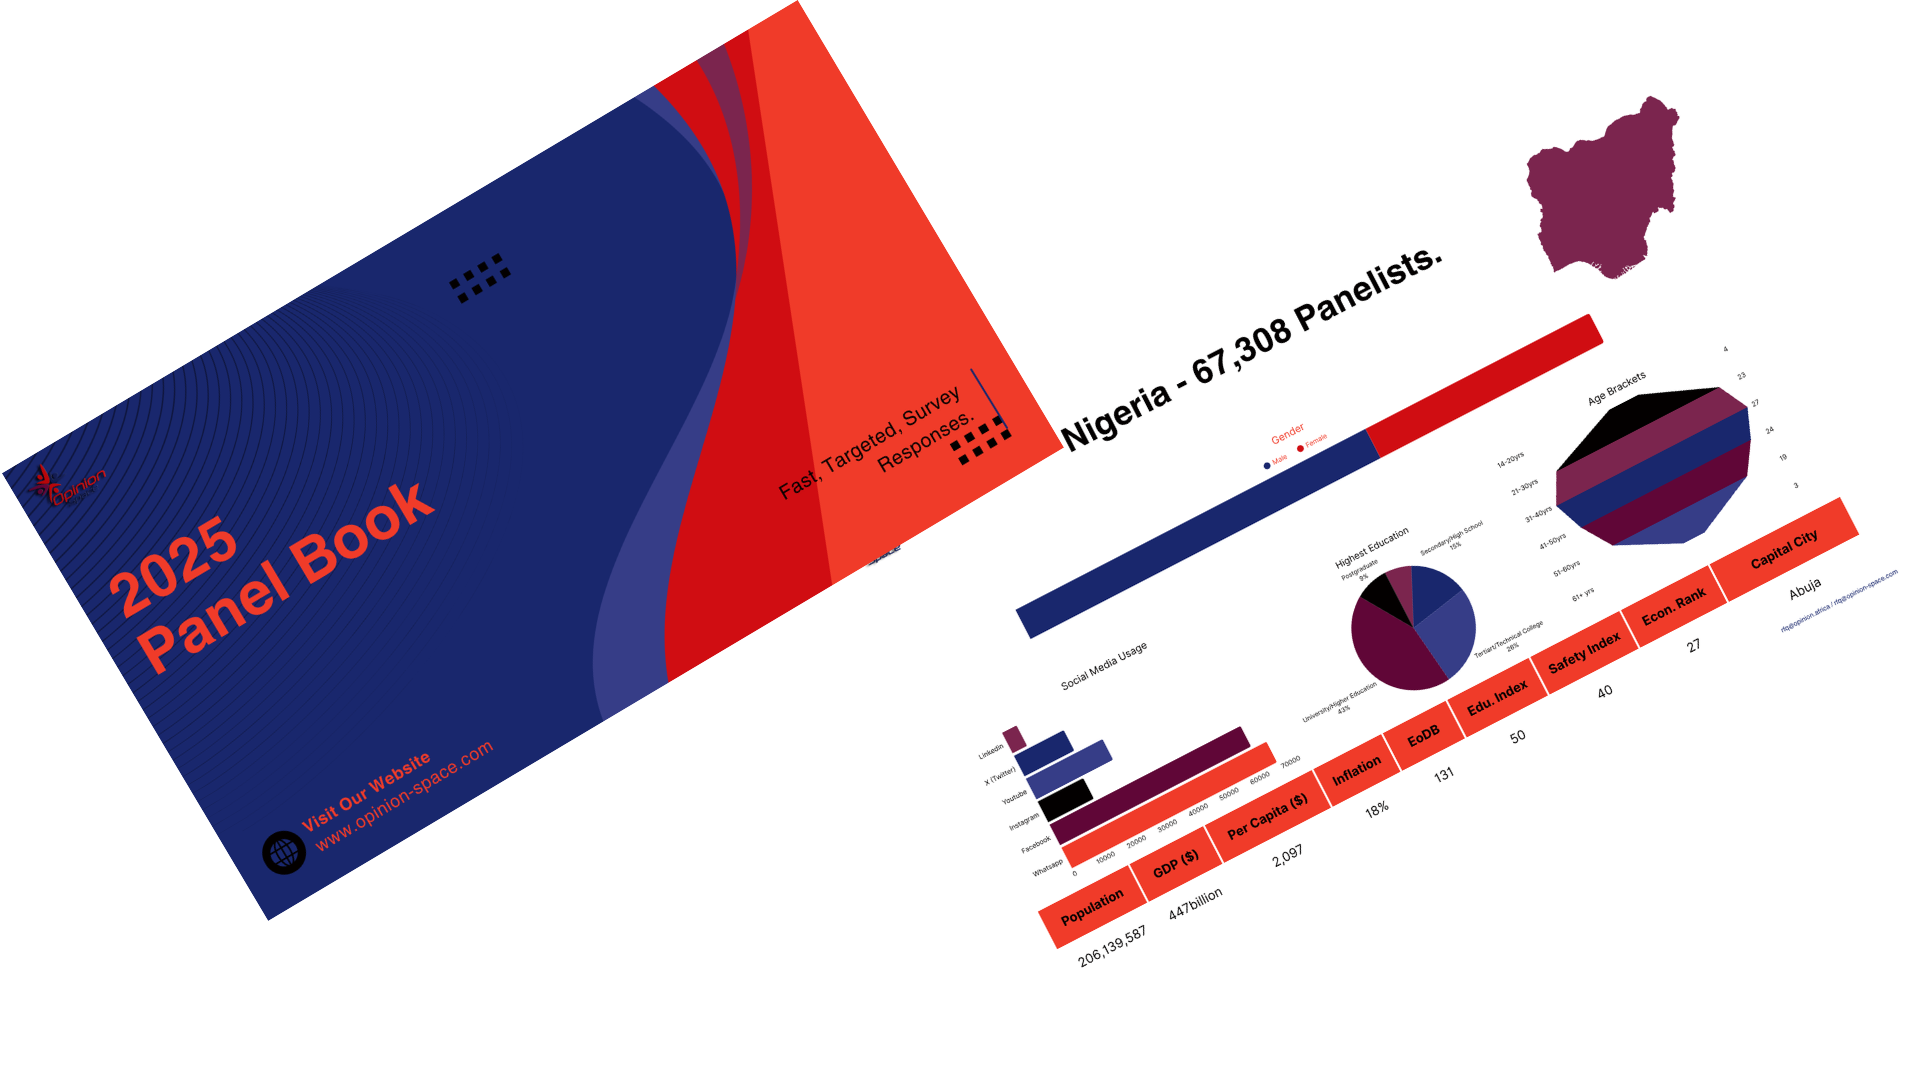
Download Our Latest Panel Book