
How to Interpret Survey Results for Academic Projects

How to Interpret Survey Results for Academic Projects
Conducting a survey is an exciting step in any academic project — but the real value comes from understanding what the results actually mean. Many students collect responses only to get stuck when it’s time to interpret the data. What do the numbers say? How do you identify patterns? What should you highlight in your report?
Interpreting survey results is less about complicated statistics and more about thoughtful analysis. It’s about looking for stories in the data — stories that explain what people think, how they behave, and why certain patterns appear. This guide breaks the process into simple steps to help you turn raw responses into clear, meaningful conclusions for your Academic assignment.
Start by Organizing Your Data
Before interpretation begins, the survey results need to be clean and well organized. This means checking for incomplete responses, removing duplicates, and ensuring answers are properly categorized. When your data is tidy, it becomes much easier to spot trends and make accurate observations.
Most academic projects rely on simple tools like Google Forms, Excel, or basic survey platforms — all of which allow you to review results easily through tables, charts, and summaries.
Look for Big Patterns First
When you begin analyzing survey results, don’t dive straight into tiny details. Start with the big picture. What do most respondents say? Are there clear majority opinions or behaviors? What stands out immediately?
For example, if you’re researching study habits and 75% of students say they study at night, that’s a big pattern worth noting. These broad findings give you your first clues about what the data means.
Compare Groups When Relevant
Sometimes the most interesting insights come from comparing groups within your survey. These groups could be based on age, class level, gender, study routine, or any other variable you included.
For example:
- Do older students study differently than younger ones?
- Do students who play sports manage time differently from those who don’t?
- Do boys and girls express different preferences in your topic?
Comparing groups helps you uncover meaningful differences that strengthen your project’s findings.
Pay Attention to Surprising or Unusual Results
Unexpected results are often the most insightful. If something doesn’t match your assumptions or contradicts common belief, that’s worth exploring. Maybe fewer students prefer online learning than you thought. Or maybe a large group reports feeling stressed despite having good study habits.
These findings deepen your interpretation and show your teacher that you’ve thought critically about the data.
Use Charts and Visuals to Strengthen Understanding
Visuals help transform numbers into something easier to understand. Charts can reveal patterns that are hard to see in raw tables. Use:
- Bar charts for comparisons
- Pie charts for percentages
- Line graphs for trends (if your survey tracks change over time)
When interpreting these visuals, focus on the story they tell. A chart showing 60% of respondents choosing one option and 20% choosing another tells you something meaningful — don’t just present the chart, explain what it means.
Interpret Open-Ended Responses Thoughtfully
If your survey includes open-ended questions, these answers require a different kind of interpretation. Instead of counting responses, look for common themes. Are many students mentioning workload? Motivation? Teacher support? Environmental factors?
Summarizing patterns in open-ended answers shows that you’ve understood the qualitative side of your survey, not just the numbers.
Example:
“Many students mentioned distractions at home as a major challenge, highlighting a consistent theme across responses.”
Connect Findings Back to Your Research Question
A common mistake in academic projects is presenting survey results without linking them back to the original purpose of the study. After identifying patterns, always ask yourself:
- How does this answer my research question?
- What does this suggest about the issue I’m studying?
- Do the results support or contradict what I expected?
Your interpretation becomes stronger when each finding clearly relates to your project’s goals.
Acknowledge Limitations
No survey is perfect — and teachers appreciate when students understand this. Perhaps your sample size was small, or not everyone answered every question. Maybe most respondents came from the same class or age group.
Stating limitations shows academic maturity and demonstrates you understand how research works.
Draw Clear, Evidence-Based Conclusions
Once you’ve identified patterns, made comparisons, reviewed open-ended responses, and connected everything back to your research question, it’s time to conclude your findings. Your conclusions should be:
- Supported by data
- Clearly explained
- Connected to your topic
- Insightful rather than superficial
A strong conclusion goes beyond describing results — it explains what they mean and why they matter.
Conclusion
Interpreting survey results is one of the most rewarding steps in a academic project. It’s where data turns into insight and where your research truly comes to life. By organizing your results carefully, looking for patterns, comparing groups, analyzing open-ended responses, and tying everything back to your research question, you can create a compelling and thoughtful interpretation that strengthens your entire project.
Good interpretation shows understanding, curiosity, and analytical thinking — the qualities teachers look for in excellent academic research.
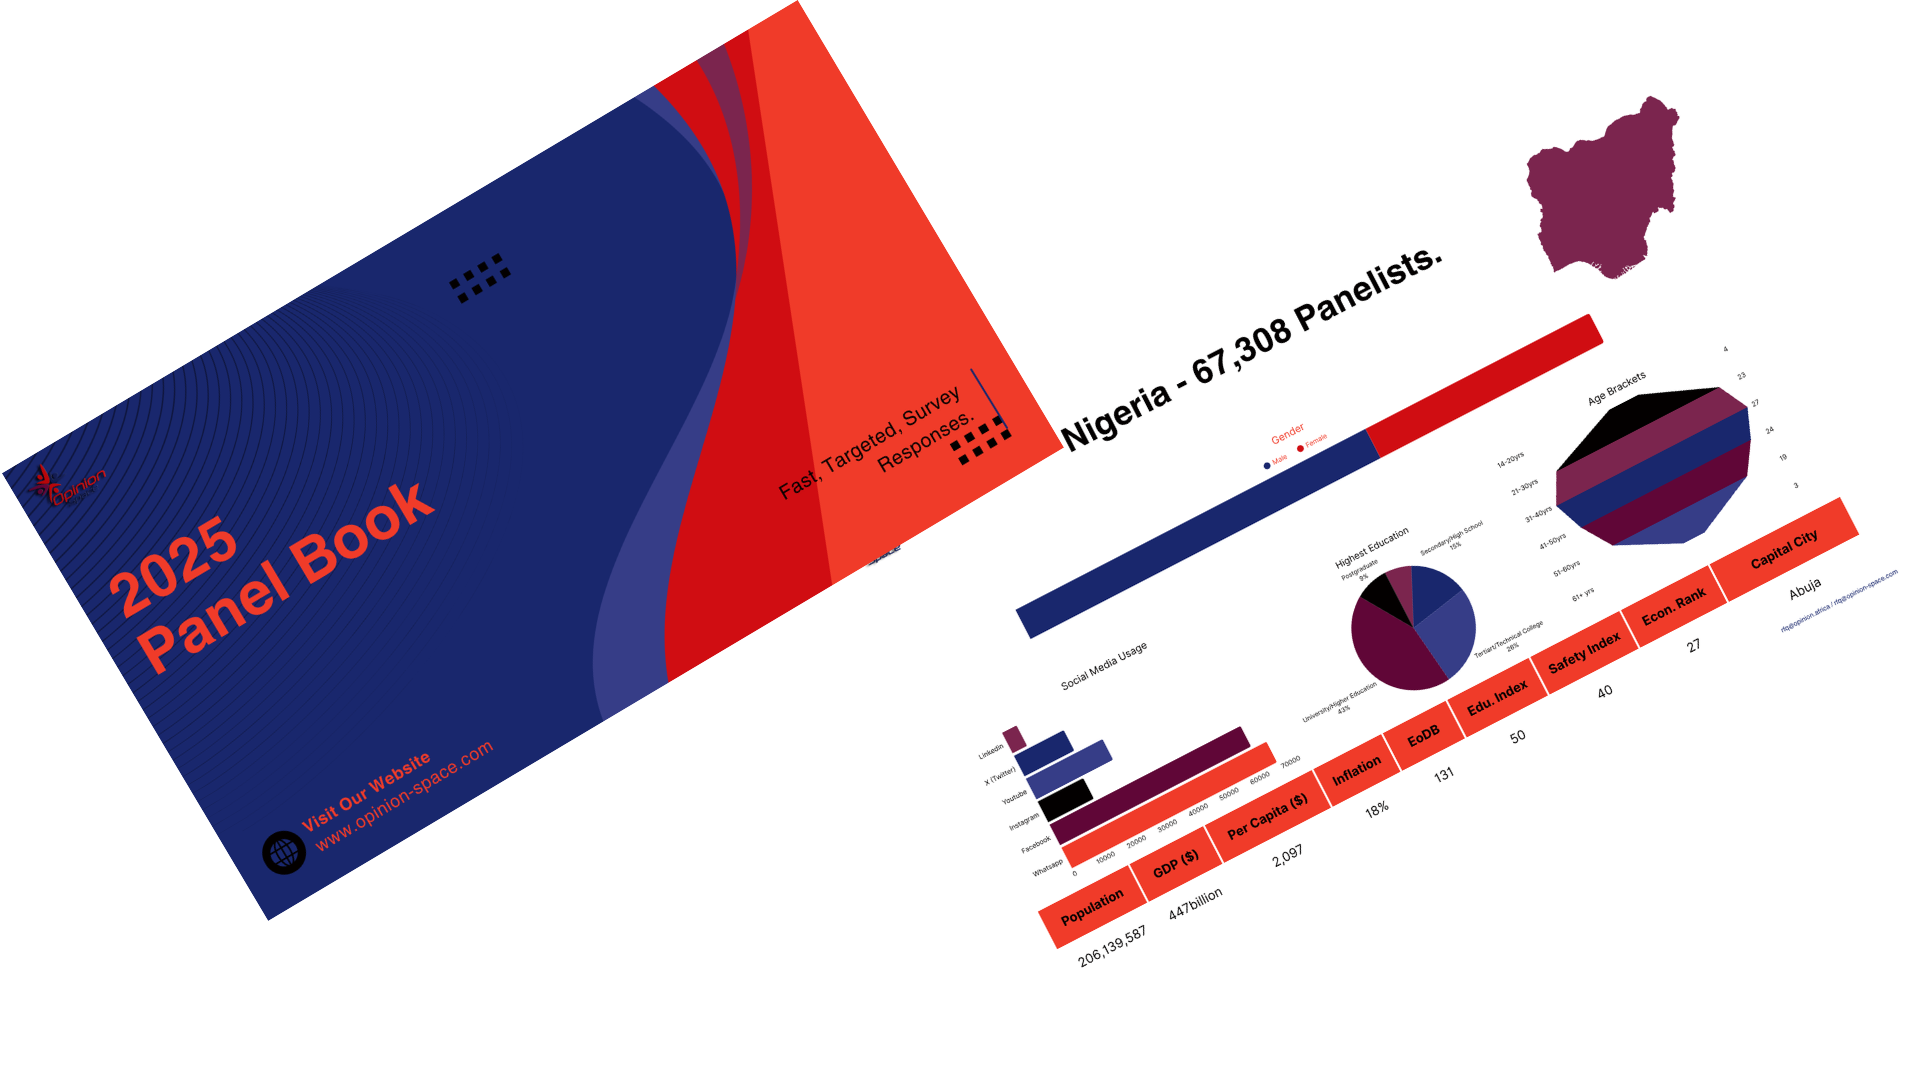
Download Our Latest Panel Book